


Недавние
-
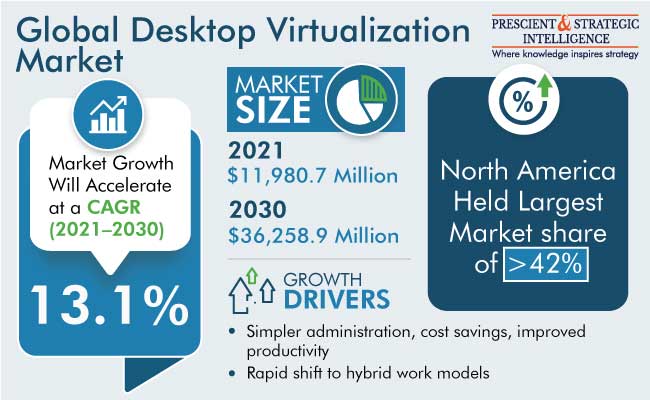
Why North America Holds Largest Share in Desktop Virtualization Market
Client/server architecture is the standard foundation for desktop virtualization, in which the organization's preferred operating system and applications operate on a server housed either in a data center or in the cloud. This architecture is reminiscent of the so-called "dumb" terminals that were common on mainframes and early Unix systems, where all user interactions take place on a local device of the user's choosing.
Moreover, in comparison to traditional desktop computers, it has several benefits, including easier administration, lower costs, more productivity, support for a wide range of kinds of devices, agility and scalability, stronger security, and better operator experiences. The desktop virtualization market is on the track to hit $36,258.9 million by 2030, growing at a 13.1% CAGR from 2021 to 2030.
The cloud-based category held a larger market share in terms of revenue generation, in the year 2021. Through the internet, cloud-based computing provides access to software that is using shared resources including processing power, disc storage, and memory. These computer resources are maintained by remote data centers, which were designed specifically to host programs on various platforms.
North America holds the largest share in the global desktop virtualization market. This is mostly credited to the region's advanced IT infrastructure, which was made possible by significant IT investment, adoption of 5G technology, and early adoption of cloud-based technologies. This technology is widely used at universities, colleges, and K–12 district schools, which explains why there is a high requirement for virtual desktop software in this area than elsewhere.
Types of Desktop Virtualization
In the desktop virtualization market, the three most common types of desktop virtualization: Remote desktop services (RDS), Desktop-as-a-Service (DaaS), and Virtual desktop infrastructure (VDI).
• By giving service providers the role and responsibility for desktop virtualization, DaaS significantly decreases the strain on the IT department. The predictable monthly prices that DaaS providers build their business model on will be appreciated by organizations that desire to convert IT spending from capital expenses to operational expenses.
• The growing need for secure virtual desktops when working remotely, especially now that the epidemic has prompted companies to adopt hybrid work practices. This is why, DaaS generated about 25.0% of the desktop virtualization market revenue in past, and it will grow CAGR of 13.5% during the forecast period.
• VDI replicates the well-known desktop computing concept and operates on VMs in either an on-premises data center or the cloud. Adopting this strategy allows businesses to administer the desktop virtualization server just like any other on-premises application server.
• RDS is frequently used in place of a full Windows or Linux desktop when only a small number of applications need to be virtualized. Applications are broadcast to the local device, which has its own OS, in this manner. Because only applications are virtualized, RDS systems may provide a greater user density per VM.
Several big companies in the desktop virtualization software market are continuously busy with innovations of products and enhancing their customer base and position. These companies are Parallels International GmbH, Amazon Web Services, Citrix systems Inc., Microsoft Corporation, Nutanix Inc., Huawei Technologies Co. Ltd., Cisco Systems Inc., Oracle Corporation, International Business Machines Corporation, and VMware Inc.
Read More: https://www.psmarketresearch.com/market-analysis/desktop-virtualization-marketWhy North America Holds Largest Share in Desktop Virtualization Market Client/server architecture is the standard foundation for desktop virtualization, in which the organization's preferred operating system and applications operate on a server housed either in a data center or in the cloud. This architecture is reminiscent of the so-called "dumb" terminals that were common on mainframes and early Unix systems, where all user interactions take place on a local device of the user's choosing. Moreover, in comparison to traditional desktop computers, it has several benefits, including easier administration, lower costs, more productivity, support for a wide range of kinds of devices, agility and scalability, stronger security, and better operator experiences. The desktop virtualization market is on the track to hit $36,258.9 million by 2030, growing at a 13.1% CAGR from 2021 to 2030. The cloud-based category held a larger market share in terms of revenue generation, in the year 2021. Through the internet, cloud-based computing provides access to software that is using shared resources including processing power, disc storage, and memory. These computer resources are maintained by remote data centers, which were designed specifically to host programs on various platforms. North America holds the largest share in the global desktop virtualization market. This is mostly credited to the region's advanced IT infrastructure, which was made possible by significant IT investment, adoption of 5G technology, and early adoption of cloud-based technologies. This technology is widely used at universities, colleges, and K–12 district schools, which explains why there is a high requirement for virtual desktop software in this area than elsewhere. Types of Desktop Virtualization In the desktop virtualization market, the three most common types of desktop virtualization: Remote desktop services (RDS), Desktop-as-a-Service (DaaS), and Virtual desktop infrastructure (VDI). • By giving service providers the role and responsibility for desktop virtualization, DaaS significantly decreases the strain on the IT department. The predictable monthly prices that DaaS providers build their business model on will be appreciated by organizations that desire to convert IT spending from capital expenses to operational expenses. • The growing need for secure virtual desktops when working remotely, especially now that the epidemic has prompted companies to adopt hybrid work practices. This is why, DaaS generated about 25.0% of the desktop virtualization market revenue in past, and it will grow CAGR of 13.5% during the forecast period. • VDI replicates the well-known desktop computing concept and operates on VMs in either an on-premises data center or the cloud. Adopting this strategy allows businesses to administer the desktop virtualization server just like any other on-premises application server. • RDS is frequently used in place of a full Windows or Linux desktop when only a small number of applications need to be virtualized. Applications are broadcast to the local device, which has its own OS, in this manner. Because only applications are virtualized, RDS systems may provide a greater user density per VM. Several big companies in the desktop virtualization software market are continuously busy with innovations of products and enhancing their customer base and position. These companies are Parallels International GmbH, Amazon Web Services, Citrix systems Inc., Microsoft Corporation, Nutanix Inc., Huawei Technologies Co. Ltd., Cisco Systems Inc., Oracle Corporation, International Business Machines Corporation, and VMware Inc. Read More: https://www.psmarketresearch.com/market-analysis/desktop-virtualization-market0 Комментарии 0 Поделились 0 Отзывы -
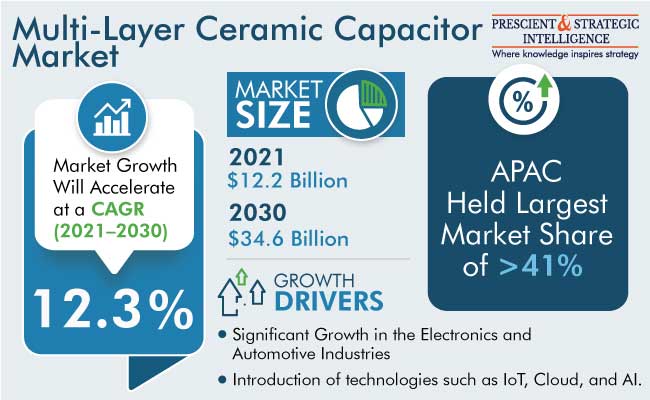
What are the industrial applications of MLCC?
Capacitors that are used for small-value capacitances are known as multi-layer capacitors. They are utilized in op-amp circuits, bypass capacitors, filters, and others. MLCCs are made up of alternating metallic electrodes and dielectric ceramic layers.
There are numerous advantages of MLCC, such as:
• Small parasitic inductance that offers better high-frequency performance compared to aluminum electrolytic capacitors.
• They offer better stability on temperature by relying on the temperature coefficient.
In 2021, the multi-layer ceramic capacitor industry generates $12.2 million revenue, and it is projected to advance at a rate of 12.3%, to capture 34.6 billion revenue in 2030. The high-capacitance MLCCs are integrated into electronic control units in automobiles led by the technical improvements in IoT equipment and infotainment, the development of connected cars, and the growing adoption of ADAS. Therefore, it leads to high demand for MLCCs.
MLCCs are highly required in electric vehicles compared to conventional vehicles that run on petroleum or gasoline. The growing road traction of electric vehicles leads to the increasing demand for MLCCs, which is five times higher than conventional automobiles. For instance, more than 9000 MLCCs are integrated into the TESLA Model 3 automobile, and the Model X and S are equipped with more than 10,000 MLCCs.
Ceramic dielectric capacitors are highly utilized for discriminating circuits, along with decoupling and bypass applications. They are also used for filtering and transient voltage suppression. Therefore, such factors lead to the increasing demand for multi-layer ceramic capacitors. Moreover, the X7R dielectric capacitor is the most significantly used capacitor led by its functioning at maximum temperature and temperature stability.
Moreover, the X5R MLCCs are widely used in mobile devices such as portable gadgets, gaming machines, smartphones, and automobile-mounted electronics. The growing popularity of such mobile devices leads to the increasing demand for the X5R multi-layer ceramic capacitors.
Electronic systems requiring high capacitance and high voltage rely on high-range voltage MLCC capacitors due to advanced ceramic dielectric ceramic thin layers as well as multi-layering methods facilitated in them.
They are used in varying applications such as lighting ballasts, high-voltage coupling capacitors, inverter circuits, and switched-mode power supply systems. In addition, mid-range voltage MLCCs offer numerous advantages such as no polarity, low leakage, low cost, and high capacitance-to-volume ratio which lead to their massive usage in various electronic systems. In addition, these capacitors offer lower ESR/ESL and higher mechanical strength compared to electrolytic capacitors.
MLCCs are also utilized in other sectors such as medical industrial equipment, telecommunications, and the military. They are widely employed in high-frequency RF devices, military communications devices, telecom base stations, and lasers due to the easy installation on circuit boards, enhanced assembly efficiency, and low inductance offered by shorter circuit tracks.
The major players operating in the MLCC industry are Taiyo Yuden Co. Ltd., Eyang Technology Development Co. Ltd., Knowles Capacitors, API Technologies Corp., Walsin Technology Corporation, Yageo Corporation, KEMET Corporation, and Kyocera Corporation.
Therefore, rising road traction of electric vehicles equipped with ADAS, IoT, and infotainment equipment leads to increasing demand for MLCCs.
Read More: https://www.psmarketresearch.com/market-analysis/multi-layer-ceramic-capacitor-mlcc-marketWhat are the industrial applications of MLCC? Capacitors that are used for small-value capacitances are known as multi-layer capacitors. They are utilized in op-amp circuits, bypass capacitors, filters, and others. MLCCs are made up of alternating metallic electrodes and dielectric ceramic layers. There are numerous advantages of MLCC, such as: • Small parasitic inductance that offers better high-frequency performance compared to aluminum electrolytic capacitors. • They offer better stability on temperature by relying on the temperature coefficient. In 2021, the multi-layer ceramic capacitor industry generates $12.2 million revenue, and it is projected to advance at a rate of 12.3%, to capture 34.6 billion revenue in 2030. The high-capacitance MLCCs are integrated into electronic control units in automobiles led by the technical improvements in IoT equipment and infotainment, the development of connected cars, and the growing adoption of ADAS. Therefore, it leads to high demand for MLCCs. MLCCs are highly required in electric vehicles compared to conventional vehicles that run on petroleum or gasoline. The growing road traction of electric vehicles leads to the increasing demand for MLCCs, which is five times higher than conventional automobiles. For instance, more than 9000 MLCCs are integrated into the TESLA Model 3 automobile, and the Model X and S are equipped with more than 10,000 MLCCs. Ceramic dielectric capacitors are highly utilized for discriminating circuits, along with decoupling and bypass applications. They are also used for filtering and transient voltage suppression. Therefore, such factors lead to the increasing demand for multi-layer ceramic capacitors. Moreover, the X7R dielectric capacitor is the most significantly used capacitor led by its functioning at maximum temperature and temperature stability. Moreover, the X5R MLCCs are widely used in mobile devices such as portable gadgets, gaming machines, smartphones, and automobile-mounted electronics. The growing popularity of such mobile devices leads to the increasing demand for the X5R multi-layer ceramic capacitors. Electronic systems requiring high capacitance and high voltage rely on high-range voltage MLCC capacitors due to advanced ceramic dielectric ceramic thin layers as well as multi-layering methods facilitated in them. They are used in varying applications such as lighting ballasts, high-voltage coupling capacitors, inverter circuits, and switched-mode power supply systems. In addition, mid-range voltage MLCCs offer numerous advantages such as no polarity, low leakage, low cost, and high capacitance-to-volume ratio which lead to their massive usage in various electronic systems. In addition, these capacitors offer lower ESR/ESL and higher mechanical strength compared to electrolytic capacitors. MLCCs are also utilized in other sectors such as medical industrial equipment, telecommunications, and the military. They are widely employed in high-frequency RF devices, military communications devices, telecom base stations, and lasers due to the easy installation on circuit boards, enhanced assembly efficiency, and low inductance offered by shorter circuit tracks. The major players operating in the MLCC industry are Taiyo Yuden Co. Ltd., Eyang Technology Development Co. Ltd., Knowles Capacitors, API Technologies Corp., Walsin Technology Corporation, Yageo Corporation, KEMET Corporation, and Kyocera Corporation. Therefore, rising road traction of electric vehicles equipped with ADAS, IoT, and infotainment equipment leads to increasing demand for MLCCs. Read More: https://www.psmarketresearch.com/market-analysis/multi-layer-ceramic-capacitor-mlcc-market0 Комментарии 0 Поделились 0 Отзывы -
5G Security Market is Dominated by North America
As per a statement by P&S Intelligence, the 5G security market generated a value of USD 1.63 billion in 2022, and it will propel at a 40.60% CAGR, to touch USD 24.89 billion, by 2030.
The growth in the industry is mainly ascribed to the growing requirement for fast network connection and the mounting concern about security for 5G networks because of the increasing attacks on them.
Additionally, growth opportunities will rise due to the requirement for private 5G networks in the government, industrial, and businesses sector, along with the increasing operator investments in dynamic infrastructure.
The services category will witness faster growth over this decade, at a rate of approximately 41.2%. The requirement for service between end users has grown with the developing technological trends.
In 2022, the 5G NR non-standalone architecture category held a share of over 64.0%.
Whereas, the standalone 5G category will gain more traction in the years to come. This is credited to the fact that more than offering a higher capacity, it also provides Ultrareliable Low Latency Communications.
Based on deployment, in 2022, the cloud category accounted for the larger 5G security market share, of 69%, and it is also expected to be the fastest growing, growing at a rate of 42%. This is mainly ascribed to the low cost of the cloud, particularly for small and medium-sized enterprises.
North America dominated the 5G security industry, owing to the significant developments of 5G technology and the implementation of security measures to prevent leaks. Spectra for the fifth generation are being disseminated successfully across North America, in both the low-band and high-band ranges.
The U.S. is expected to witness a strong growth rate in the North American Industry, growing at a rate of approximately 40%, in the years to come. The fifth-generation security approach offers a more effective means to address improvements in the network, therefore rising the technological ability of the nation to develop and contribute.
APAC is the second-fastest growing industry in the global 5G security industry, owing to the large mobile subscriber pool, due to its large population.
Moreover, APAC is home to the most users of mobile in the world, and the nations in this region will keep increasing their telecom networks in the years to come. The strategic leadership, economic diversity, and size of countries, for instance, China, Singapore, Australia, Japan, and South Korea will be the main reasons for the growth of the industry.
Hence, with the robust requirement for digitization across industries and the increasing threats of cyberattacks on telecommunication networks, the 5G security industry will grow significantly in the years to come.
Read More: https://www.psmarketresearch.com/market-analysis/5g-security-market-report5G Security Market is Dominated by North America As per a statement by P&S Intelligence, the 5G security market generated a value of USD 1.63 billion in 2022, and it will propel at a 40.60% CAGR, to touch USD 24.89 billion, by 2030. The growth in the industry is mainly ascribed to the growing requirement for fast network connection and the mounting concern about security for 5G networks because of the increasing attacks on them. Additionally, growth opportunities will rise due to the requirement for private 5G networks in the government, industrial, and businesses sector, along with the increasing operator investments in dynamic infrastructure. The services category will witness faster growth over this decade, at a rate of approximately 41.2%. The requirement for service between end users has grown with the developing technological trends. In 2022, the 5G NR non-standalone architecture category held a share of over 64.0%. Whereas, the standalone 5G category will gain more traction in the years to come. This is credited to the fact that more than offering a higher capacity, it also provides Ultrareliable Low Latency Communications. Based on deployment, in 2022, the cloud category accounted for the larger 5G security market share, of 69%, and it is also expected to be the fastest growing, growing at a rate of 42%. This is mainly ascribed to the low cost of the cloud, particularly for small and medium-sized enterprises. North America dominated the 5G security industry, owing to the significant developments of 5G technology and the implementation of security measures to prevent leaks. Spectra for the fifth generation are being disseminated successfully across North America, in both the low-band and high-band ranges. The U.S. is expected to witness a strong growth rate in the North American Industry, growing at a rate of approximately 40%, in the years to come. The fifth-generation security approach offers a more effective means to address improvements in the network, therefore rising the technological ability of the nation to develop and contribute. APAC is the second-fastest growing industry in the global 5G security industry, owing to the large mobile subscriber pool, due to its large population. Moreover, APAC is home to the most users of mobile in the world, and the nations in this region will keep increasing their telecom networks in the years to come. The strategic leadership, economic diversity, and size of countries, for instance, China, Singapore, Australia, Japan, and South Korea will be the main reasons for the growth of the industry. Hence, with the robust requirement for digitization across industries and the increasing threats of cyberattacks on telecommunication networks, the 5G security industry will grow significantly in the years to come. Read More: https://www.psmarketresearch.com/market-analysis/5g-security-market-report0 Комментарии 0 Поделились 0 Отзывы -
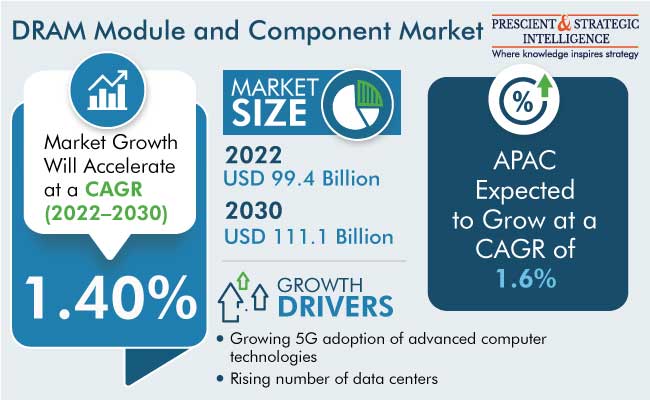
Demand for DRAM Module and Component was Highest in APAC
The DRAM module and component market will power at a rate of 1.40% during 2022–2030, to touch USD 111.1 billion by 2030.
The development acceptance of IoT and 5G, growing data center count, and increasing use of DRAM modules and components in numerous industries are the main factors powering the growth of the industry.
The above 8 GB category will have the largest share and grow at a rate of 1.6% in the years to come. It is because of the necessity for a high memory capacity for the storage, processing, and high-volume data transmission.
The rate at which data is generated has been observing a considerable growth in the last ten years or so. The processing of heavy data has also become common these days as a result of the introduction of numerous advanced tech products and solutions. This requires to frequently update them, for effective functioning.
Automobiles will grow at a rate of over 1.6% in the years to come.
The growth can be credited to the introduction of cutting-edge digital devices and uses for improved performance and user experience development, by allowing a more-contented and safer drive.
The rising acceptance of IoT devices, automation solutions, and distant access applications in automobiles would principally contribute toward the growth of the industry.
DRAM components support in the effective running of uses precisely meant for automation, dependability, safety, and performance improvement in vehicles.
Automobiles are witnessing continuous innovations, and they are now making use of numerous computer applications, sensors, and software to improve their performance. DRAM with numerous memory capacity starting from 2 GB can be deployed in vehicles.
Furthermore, electronics corporations have begun to get certifications for their cutting-edge memory products used for enhancing vehicle safety and performance.
APAC had the DRAM module and component market share in the past, and it is will retain its position in the future, as stated by a market research institution, P&S Intelligence.
Moreover, it will grow at a rate of 1.6% in the future, credited to the development of the semiconductor industry and the development in the requirement for smart electronic devices from India and China.
With the fast pace at which the acceptance of smart digital devices in the countries of the region is progressing, a stimulation of the requirement for DRAM modules and components, as a result of their capability to cater to the memory necessities of those devices, is likely
It is because of the increasing number of data centers, all over the world, the demand for DRAM module and component will continue to grow in the years to come.
Read More: https://www.psmarketresearch.com/market-analysis/dram-module-component-marketDemand for DRAM Module and Component was Highest in APAC The DRAM module and component market will power at a rate of 1.40% during 2022–2030, to touch USD 111.1 billion by 2030. The development acceptance of IoT and 5G, growing data center count, and increasing use of DRAM modules and components in numerous industries are the main factors powering the growth of the industry. The above 8 GB category will have the largest share and grow at a rate of 1.6% in the years to come. It is because of the necessity for a high memory capacity for the storage, processing, and high-volume data transmission. The rate at which data is generated has been observing a considerable growth in the last ten years or so. The processing of heavy data has also become common these days as a result of the introduction of numerous advanced tech products and solutions. This requires to frequently update them, for effective functioning. Automobiles will grow at a rate of over 1.6% in the years to come. The growth can be credited to the introduction of cutting-edge digital devices and uses for improved performance and user experience development, by allowing a more-contented and safer drive. The rising acceptance of IoT devices, automation solutions, and distant access applications in automobiles would principally contribute toward the growth of the industry. DRAM components support in the effective running of uses precisely meant for automation, dependability, safety, and performance improvement in vehicles. Automobiles are witnessing continuous innovations, and they are now making use of numerous computer applications, sensors, and software to improve their performance. DRAM with numerous memory capacity starting from 2 GB can be deployed in vehicles. Furthermore, electronics corporations have begun to get certifications for their cutting-edge memory products used for enhancing vehicle safety and performance. APAC had the DRAM module and component market share in the past, and it is will retain its position in the future, as stated by a market research institution, P&S Intelligence. Moreover, it will grow at a rate of 1.6% in the future, credited to the development of the semiconductor industry and the development in the requirement for smart electronic devices from India and China. With the fast pace at which the acceptance of smart digital devices in the countries of the region is progressing, a stimulation of the requirement for DRAM modules and components, as a result of their capability to cater to the memory necessities of those devices, is likely It is because of the increasing number of data centers, all over the world, the demand for DRAM module and component will continue to grow in the years to come. Read More: https://www.psmarketresearch.com/market-analysis/dram-module-component-market0 Комментарии 0 Поделились 0 Отзывы -
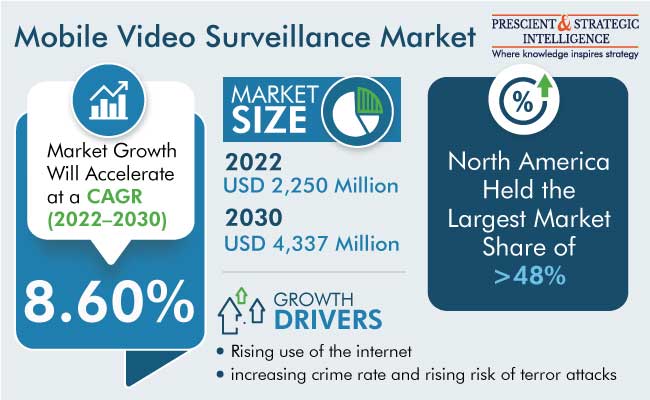
Mobile Video Surveillance Market is Dominated by North America
The size of the mobile video surveillance market was USD 2,250 million in 2022, and it will power at a rate of 8.6% in the years to come, to touch USD 4,337 million by 2030.
On the basis of offering, hardware had a major share, of 42%, credited to the progressions in cameras, for example improved recording quality in low light, cohesive motion sensors for object tracking, encryption of data and other cybersecurity measures, in-built microphones for recording audio accompanied by the video, and support for both cellular and Wi-Fi networks.
Additionally, the growing acceptance of mobile video surveillance systems globally is credited to the dipping prices of these kinds of cameras, which will further surge the requirement for storage solutions at the highest rate in the years to come.
The transportation vertical will have the largest share, of over 60%, because of the incessant efforts of governments, transport authorities, and companies to deliver more flexible and expedient technologies for offering passengers theft protection, vandalism, fraud, and terrorism.
With the usage of tablets and smartphones, the concept of the simultaneous monitoring of live video feed comes within reach. The feed can be accessed through mobile devices, for example tablets, smartphones, and laptops, connected to the internet, supporting in improving public safety and security by delivering timely involvement in any unsolicited incident.
North America led the mobile video surveillance market, and it the trend will continue like this in the years to come, with USD 1,080 million. It is because of the rapid acceptance of cutting-edge technologies.
The region has also observed a number of terrorists and criminal attacks in the recent past, as stated by a market research institution, P&S Intelligence.
Consequently, the growing usage of these cameras along state and international borders will power the requirement for them in the years to come in North America.
The usage of AI in cameras supports in taking better photos, by enhancing the camera settings accordingly and recognizing objects and scenes intelligently. Before the incorporation of AI, video monitoring was an inert tool and required constant monitoring to determine the existence of suspicious activities. With the incorporation of AI in video examination, systems can monitor a precise activity and respond accordingly.
A complete AI-integrated system also comprises programs to examine the camera’s images and audio, for recognizing humans. The growing demand for real-time and remote access amongst users, to endlessly observe industrial sites, is added an important opportunity solution providers can leverage.
Due to the increasing usage of internet, the demand for mobile video surveillance is on the rise, all over the world.
Read More: https://www.psmarketresearch.com/market-analysis/mobile-video-surveillance-marketMobile Video Surveillance Market is Dominated by North America The size of the mobile video surveillance market was USD 2,250 million in 2022, and it will power at a rate of 8.6% in the years to come, to touch USD 4,337 million by 2030. On the basis of offering, hardware had a major share, of 42%, credited to the progressions in cameras, for example improved recording quality in low light, cohesive motion sensors for object tracking, encryption of data and other cybersecurity measures, in-built microphones for recording audio accompanied by the video, and support for both cellular and Wi-Fi networks. Additionally, the growing acceptance of mobile video surveillance systems globally is credited to the dipping prices of these kinds of cameras, which will further surge the requirement for storage solutions at the highest rate in the years to come. The transportation vertical will have the largest share, of over 60%, because of the incessant efforts of governments, transport authorities, and companies to deliver more flexible and expedient technologies for offering passengers theft protection, vandalism, fraud, and terrorism. With the usage of tablets and smartphones, the concept of the simultaneous monitoring of live video feed comes within reach. The feed can be accessed through mobile devices, for example tablets, smartphones, and laptops, connected to the internet, supporting in improving public safety and security by delivering timely involvement in any unsolicited incident. North America led the mobile video surveillance market, and it the trend will continue like this in the years to come, with USD 1,080 million. It is because of the rapid acceptance of cutting-edge technologies. The region has also observed a number of terrorists and criminal attacks in the recent past, as stated by a market research institution, P&S Intelligence. Consequently, the growing usage of these cameras along state and international borders will power the requirement for them in the years to come in North America. The usage of AI in cameras supports in taking better photos, by enhancing the camera settings accordingly and recognizing objects and scenes intelligently. Before the incorporation of AI, video monitoring was an inert tool and required constant monitoring to determine the existence of suspicious activities. With the incorporation of AI in video examination, systems can monitor a precise activity and respond accordingly. A complete AI-integrated system also comprises programs to examine the camera’s images and audio, for recognizing humans. The growing demand for real-time and remote access amongst users, to endlessly observe industrial sites, is added an important opportunity solution providers can leverage. Due to the increasing usage of internet, the demand for mobile video surveillance is on the rise, all over the world. Read More: https://www.psmarketresearch.com/market-analysis/mobile-video-surveillance-market0 Комментарии 0 Поделились 0 Отзывы -
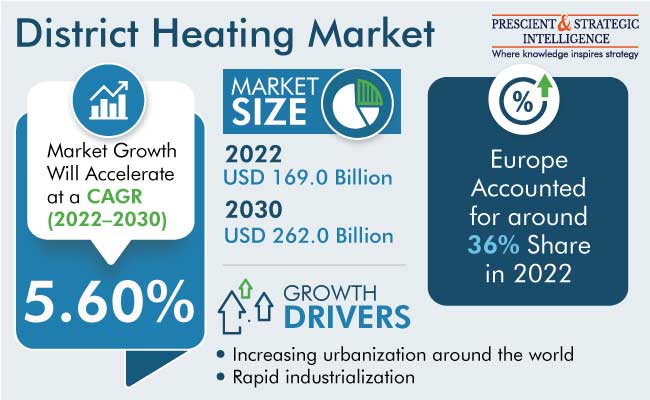
District Heating Market to Observe Fastest Growth in APAC
The district heating market was USD 169 billion in 2022, and it will touch USD 262 billion, advancing at a 5.6% compound annual growth rate, by 2030.
The growth of the industry is mainly attributed to the surging population of cities, which results in rapid urbanization across the globe. Because of this move to urban from rural areas, the requirement for energy is mounting across all the end users. As a result, significant fundings have been made in district heating systems.
A key trend being observed in the industry is the utilization of renewable heat sources, including heat pumps, bioenergy, geothermal, and solar–thermal, and also waste heat from data centers and other industries.
In 2022, the industrial category, based on application, dominated the district heating market, mainly because of rapid industrialization. According to the International Energy Agency, industrial heat generates approximately one-third of the industrial energy requirement and one-fifth of the energy consumption across the globe.
Whereas, the residential category will advance at a significant rate in the years to come, owing to the surging number of households across the globe. The rising urbanization level has led to an increasing requirement for energy. As a result, boosting the progression of the heating infrastructure, to make it more suitable for providing energy to modern homes.
The combined heat and power category, based on the plant type, will propel at a high rate in the years to come, primarily because of the high sustainability and cost-effectiveness of this method. Combined heat and power systems are mainly utilized in large commercial, institutional, and industrial applications.
Based on components, the heat pump category will advance at a significant rate in the years to come, primarily because of the increasing utilization of technologically advanced systems. These heat pumps are beneficial in boosting the temperature of the heat generated, which is utilized in various sectors, for instance, refining, paper, and chemical.
Moreover, with the rising rate of industrialization all over the world, the requirement for heat pumps is increasing in district heating networks. These heat pumps can lessen energy consumption and stabilize the prices of energy.
In 2022, Europe dominated the district heating industry, with over 36% share. This is because of the surging requirement for energy, growing urbanization & industrialization, government guidelines to decrease greenhouse emissions, and rising fondness for energy-efficient systems in the continent.
APAC is expected to observe the fastest growth in the years to come. This is because of the increasing industries, constantly changing climate, and rapid urbanization in the region. In addition, the rising disposable income and increasing concerns regarding CO2 emissions will further boost the progression of the regional industry.
It is because of the rapid industrialization and urbanization all across the globe, the district heating industry will continue to advance in the years to come.
Read More: https://www.psmarketresearch.com/market-analysis/district-heating-marketDistrict Heating Market to Observe Fastest Growth in APAC The district heating market was USD 169 billion in 2022, and it will touch USD 262 billion, advancing at a 5.6% compound annual growth rate, by 2030. The growth of the industry is mainly attributed to the surging population of cities, which results in rapid urbanization across the globe. Because of this move to urban from rural areas, the requirement for energy is mounting across all the end users. As a result, significant fundings have been made in district heating systems. A key trend being observed in the industry is the utilization of renewable heat sources, including heat pumps, bioenergy, geothermal, and solar–thermal, and also waste heat from data centers and other industries. In 2022, the industrial category, based on application, dominated the district heating market, mainly because of rapid industrialization. According to the International Energy Agency, industrial heat generates approximately one-third of the industrial energy requirement and one-fifth of the energy consumption across the globe. Whereas, the residential category will advance at a significant rate in the years to come, owing to the surging number of households across the globe. The rising urbanization level has led to an increasing requirement for energy. As a result, boosting the progression of the heating infrastructure, to make it more suitable for providing energy to modern homes. The combined heat and power category, based on the plant type, will propel at a high rate in the years to come, primarily because of the high sustainability and cost-effectiveness of this method. Combined heat and power systems are mainly utilized in large commercial, institutional, and industrial applications. Based on components, the heat pump category will advance at a significant rate in the years to come, primarily because of the increasing utilization of technologically advanced systems. These heat pumps are beneficial in boosting the temperature of the heat generated, which is utilized in various sectors, for instance, refining, paper, and chemical. Moreover, with the rising rate of industrialization all over the world, the requirement for heat pumps is increasing in district heating networks. These heat pumps can lessen energy consumption and stabilize the prices of energy. In 2022, Europe dominated the district heating industry, with over 36% share. This is because of the surging requirement for energy, growing urbanization & industrialization, government guidelines to decrease greenhouse emissions, and rising fondness for energy-efficient systems in the continent. APAC is expected to observe the fastest growth in the years to come. This is because of the increasing industries, constantly changing climate, and rapid urbanization in the region. In addition, the rising disposable income and increasing concerns regarding CO2 emissions will further boost the progression of the regional industry. It is because of the rapid industrialization and urbanization all across the globe, the district heating industry will continue to advance in the years to come. Read More: https://www.psmarketresearch.com/market-analysis/district-heating-market0 Комментарии 0 Поделились 0 Отзывы -
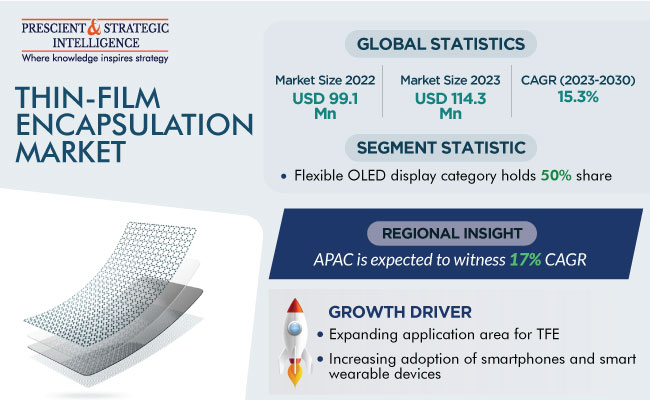
Thin-Film Encapsulation Market To Reach USD 310.4 Million by 2030
The thin-film encapsulation market will touch USD 310.4 million by 2030, growing at a compound annual growth rate of 15.3% by the end of this decade.
This has a lot to do with the growing acceptance of smart wearable devices and smartphones, which creates a high requirement for flexible displays. TFE is a significant technology in the production of these displays, as it guards and improves their durability.
OLEDs are suitable for smartphone applications as they offer numerous advantages over conventional LCDs, for example, faster response times, higher contrast, lightweight, improved flexibility and durability, and thin, and low consumption of power.
The growing requirement for wearables and smartphones has brought about enormous requirement for OLED displays. TFE is vital in extending the life and performance of OLEDs, resulting in improved requirement for encapsulation solutions.
Moreover, smartwatches, fitness trackers, and AR glasses are rising in popularity. Flexible plastic substrates are put to use in the manufacturing of displays of such products, because of which they are bendable, stretchable, foldable, and rollable. TFE supports in the manufacture of durable and flexible displays for these devices for confirming dependable performance in numerous environments.
Flexible OLED display with a 50% share was the largest in the thin-film encapsulation market in the past. This is because of the increasing usage of flexible OLED displays in numerous smartphones such as Samsung Galaxy series, iPhone, Xiaomi, and One Plus which, drives the requirement for TFE, as it is put to use for providing shield and an enclosure for OLED materials.
Additionally, TFE films are super flexible and have considerable mechanical properties, allowing them to bend and stretch accompanied by the flexible OLED displays. This flexibility is significant for these displays, as it lets them to be folded, bent, and rolled without hindering the performance of the same.
APAC will grow the fastest by the end of this decade. This is because of the existence of numerous notable flexible electronic product manufacturing plants and the renowned flexible electronic device producers in Japan, China, Taiwan, Hong Kong, and South Korea for example LG, Sony, Samsung, and Panasonic.
Furthermore, there are notable fast-moving consumer electronics industry. The growing use of smartwatches, smartphones, and other electronic devices by the increasing middle-class populace has created a vast opportunity for film encapsulation.
Likewise, the existence of producers locally makes it easy to fulfill this requirement effectively, giving them an edge over the companies from other regions.
It is because of the increasing application area of TPE, all over the world, the demand for thin-film encapsulation will continue to grow in the years to come.
Read More: https://www.psmarketresearch.com/market-analysis/thin-film-encapsulation-marketThin-Film Encapsulation Market To Reach USD 310.4 Million by 2030 The thin-film encapsulation market will touch USD 310.4 million by 2030, growing at a compound annual growth rate of 15.3% by the end of this decade. This has a lot to do with the growing acceptance of smart wearable devices and smartphones, which creates a high requirement for flexible displays. TFE is a significant technology in the production of these displays, as it guards and improves their durability. OLEDs are suitable for smartphone applications as they offer numerous advantages over conventional LCDs, for example, faster response times, higher contrast, lightweight, improved flexibility and durability, and thin, and low consumption of power. The growing requirement for wearables and smartphones has brought about enormous requirement for OLED displays. TFE is vital in extending the life and performance of OLEDs, resulting in improved requirement for encapsulation solutions. Moreover, smartwatches, fitness trackers, and AR glasses are rising in popularity. Flexible plastic substrates are put to use in the manufacturing of displays of such products, because of which they are bendable, stretchable, foldable, and rollable. TFE supports in the manufacture of durable and flexible displays for these devices for confirming dependable performance in numerous environments. Flexible OLED display with a 50% share was the largest in the thin-film encapsulation market in the past. This is because of the increasing usage of flexible OLED displays in numerous smartphones such as Samsung Galaxy series, iPhone, Xiaomi, and One Plus which, drives the requirement for TFE, as it is put to use for providing shield and an enclosure for OLED materials. Additionally, TFE films are super flexible and have considerable mechanical properties, allowing them to bend and stretch accompanied by the flexible OLED displays. This flexibility is significant for these displays, as it lets them to be folded, bent, and rolled without hindering the performance of the same. APAC will grow the fastest by the end of this decade. This is because of the existence of numerous notable flexible electronic product manufacturing plants and the renowned flexible electronic device producers in Japan, China, Taiwan, Hong Kong, and South Korea for example LG, Sony, Samsung, and Panasonic. Furthermore, there are notable fast-moving consumer electronics industry. The growing use of smartwatches, smartphones, and other electronic devices by the increasing middle-class populace has created a vast opportunity for film encapsulation. Likewise, the existence of producers locally makes it easy to fulfill this requirement effectively, giving them an edge over the companies from other regions. It is because of the increasing application area of TPE, all over the world, the demand for thin-film encapsulation will continue to grow in the years to come. Read More: https://www.psmarketresearch.com/market-analysis/thin-film-encapsulation-market0 Комментарии 0 Поделились 0 Отзывы -
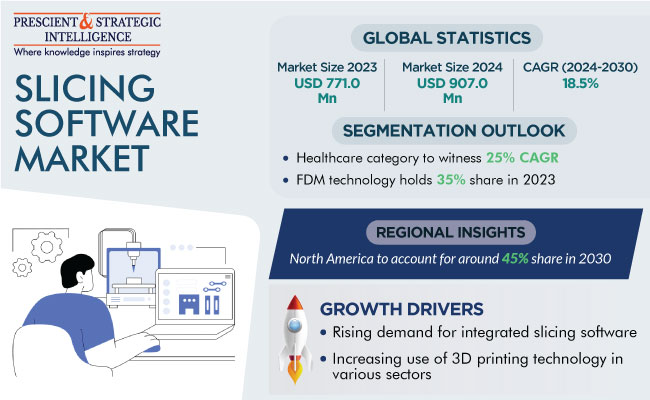
Slicing Software Market is Led by North America
The slicing software market is estimated to touch USD 771.0 million in 2023, which will rise to USD 2,516.7 million, with an 18.5% CAGR, by 2030.
The growth of this industry is because of the increasing need for integrated slicing software and the growing end-use sectors including manufacturing, healthcare, aerospace, and automobile.
The integrated category, based on product type, is leading the industry. This can be mainly because of its developed features like design optimization, model simulation, machine integration, repair capabilities, and analysis, coupled with the high demand for slicing operations.
On the basis of deployment, on-premises is the larger category. This is because of the increasing requirement to understand sensitive info locally, data security, and compliance necessities, and thus, slicing software is extensively accepted on-premises by end users.
The cloud category, on the other hand, will propel at a higher rate, during this decade. This is ascribed to its benefits including its capability to deliver greater management of the 3D printing procedure straight from a web browser.
The prototyping category, based on application, is the largest contributor to the slicing software market. Moreover, this category will also advance at the highest rate during this decade. This will be because of the growing adoption of prototyping because of the increasing need for agile products and their advancement, coupled with the mounting requirement for product customization.
Based on technology, fused deposition modeling (FDM) is the dominating category, primarily because of its extensive application in numerous sectors, including automobile, medical, and aerospace.
The aerospace & defense category, based on industry, is the largest contributor to the industry. This can be because of the growing necessity to decrease components production time and the increasing requirement for lightweight parts as well as components utilized in the aerospace sector.
Whereas, the healthcare category will propel at the fastest rate during this decade. This is because of the growth of 3D printing technology globally, which is employed to produce the most customized and complex medical devices, implants, and prosthetics.
North America dominates the industry, and it is expected to hold a 45% share in 2030. This can be ascribed to the extensive adoption of new technology, the increasing end-use sectors, and the incidence of key players in this region.
APAC will propel at the highest rate during this decade. This is because of the existence of countries including China, India, and Japan; active government support for 3D printing in different sectors; and the rising partnerships and collaborations among regional businesses.
With the surging requirement for integrated slicing software, the slicing software industry will continue to progress in the coming years.
Read More: https://www.psmarketresearch.com/market-analysis/slicing-software-market-outlookSlicing Software Market is Led by North America The slicing software market is estimated to touch USD 771.0 million in 2023, which will rise to USD 2,516.7 million, with an 18.5% CAGR, by 2030. The growth of this industry is because of the increasing need for integrated slicing software and the growing end-use sectors including manufacturing, healthcare, aerospace, and automobile. The integrated category, based on product type, is leading the industry. This can be mainly because of its developed features like design optimization, model simulation, machine integration, repair capabilities, and analysis, coupled with the high demand for slicing operations. On the basis of deployment, on-premises is the larger category. This is because of the increasing requirement to understand sensitive info locally, data security, and compliance necessities, and thus, slicing software is extensively accepted on-premises by end users. The cloud category, on the other hand, will propel at a higher rate, during this decade. This is ascribed to its benefits including its capability to deliver greater management of the 3D printing procedure straight from a web browser. The prototyping category, based on application, is the largest contributor to the slicing software market. Moreover, this category will also advance at the highest rate during this decade. This will be because of the growing adoption of prototyping because of the increasing need for agile products and their advancement, coupled with the mounting requirement for product customization. Based on technology, fused deposition modeling (FDM) is the dominating category, primarily because of its extensive application in numerous sectors, including automobile, medical, and aerospace. The aerospace & defense category, based on industry, is the largest contributor to the industry. This can be because of the growing necessity to decrease components production time and the increasing requirement for lightweight parts as well as components utilized in the aerospace sector. Whereas, the healthcare category will propel at the fastest rate during this decade. This is because of the growth of 3D printing technology globally, which is employed to produce the most customized and complex medical devices, implants, and prosthetics. North America dominates the industry, and it is expected to hold a 45% share in 2030. This can be ascribed to the extensive adoption of new technology, the increasing end-use sectors, and the incidence of key players in this region. APAC will propel at the highest rate during this decade. This is because of the existence of countries including China, India, and Japan; active government support for 3D printing in different sectors; and the rising partnerships and collaborations among regional businesses. With the surging requirement for integrated slicing software, the slicing software industry will continue to progress in the coming years. Read More: https://www.psmarketresearch.com/market-analysis/slicing-software-market-outlook0 Комментарии 0 Поделились 0 Отзывы -
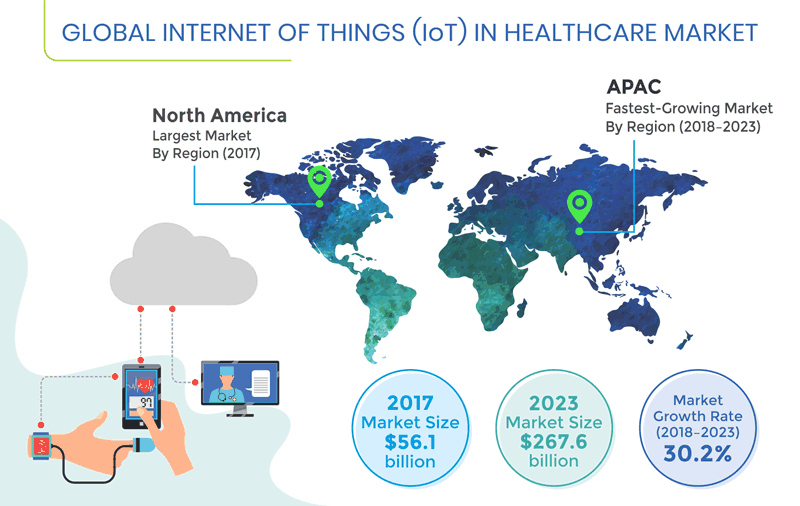
What are the Key Trends in The Internet of Things in Healthcare?
The mounting investments being made in healthcare internet of things (IoT) solutions by private and public organizations, surging penetration of connected devices in the healthcare sector, and burgeoning demand for effective and affordable medical treatment are expected to drive the IoT in healthcare market at a CAGR of 30.2% during the forecast period (2018–2023). The market revenue stood at $56.1 billion in 2017 and it is projected to reach $267.6 billion by 2023. Moreover, the booming elderly population, growing incidence of chronic and lifestyle-related diseases, and increasing applications of smartphone-based mHealth technologies also support the market growth.
One of the key growth drivers of the IoT in healthcare market is the escalating investments being made in the healthcare sector by both private and public organizations. For example, the U.S. federal government enacted the Health Information Technology for Economic and Clinical Health (HITECH) Act and the Affordable Care Act (ACA) to provide incentives to healthcare providers for adopting electronic health record (EHR) solutions, infrastructural development, and workforce training. Further, the ACA also supports medication management initiatives for enhanced healthcare in the country.
Nowadays, the rising collaborations and partnerships among the key players has become a major market trend. Through such strategic measures, market players aim to provide advanced IoT solutions to healthcare organizations. For example, in January 2018, General Electric Company entered into a long-term partnership with F. Hoffman-La Roche Ltd. to jointly develop and co-market their digital clinical decision support solutions. The partnership is focused on the creation of products that would improve personalized treatment for critically ill patients.
The component segment of the IoT in healthcare market is classified into services, medical devices, and systems and software. In 2017, the medical devices generated the highest revenue, due to the increasing usage of IoT-based devices to monitor and analyze the medical condition of patients and provide constant notification to the caregivers about the condition of patients, for further treatment. Whereas, the systems and software category will exhibit the fastest growth during the forecast period, due to the surging penetration of telemedicine across the world.
According to P&S Intelligence, North America held the largest share in the IoT in healthcare market in 2017, due to the implementation of several government and non-government organizations initiatives to augment the adoption of IoT solutions in the healthcare sector, increasing incidence of chronic diseases, and surging research and development (R&D) activities in the health information technology (HIT) sector in the region. Moreover, the presence of a well-developed healthcare infrastructure and constant technological evolution also contributed to the market growth in the region.
Read More: https://www.psmarketresearch.com/market-analysis/internet-of-things-in-healthcare-marketWhat are the Key Trends in The Internet of Things in Healthcare? The mounting investments being made in healthcare internet of things (IoT) solutions by private and public organizations, surging penetration of connected devices in the healthcare sector, and burgeoning demand for effective and affordable medical treatment are expected to drive the IoT in healthcare market at a CAGR of 30.2% during the forecast period (2018–2023). The market revenue stood at $56.1 billion in 2017 and it is projected to reach $267.6 billion by 2023. Moreover, the booming elderly population, growing incidence of chronic and lifestyle-related diseases, and increasing applications of smartphone-based mHealth technologies also support the market growth. One of the key growth drivers of the IoT in healthcare market is the escalating investments being made in the healthcare sector by both private and public organizations. For example, the U.S. federal government enacted the Health Information Technology for Economic and Clinical Health (HITECH) Act and the Affordable Care Act (ACA) to provide incentives to healthcare providers for adopting electronic health record (EHR) solutions, infrastructural development, and workforce training. Further, the ACA also supports medication management initiatives for enhanced healthcare in the country. Nowadays, the rising collaborations and partnerships among the key players has become a major market trend. Through such strategic measures, market players aim to provide advanced IoT solutions to healthcare organizations. For example, in January 2018, General Electric Company entered into a long-term partnership with F. Hoffman-La Roche Ltd. to jointly develop and co-market their digital clinical decision support solutions. The partnership is focused on the creation of products that would improve personalized treatment for critically ill patients. The component segment of the IoT in healthcare market is classified into services, medical devices, and systems and software. In 2017, the medical devices generated the highest revenue, due to the increasing usage of IoT-based devices to monitor and analyze the medical condition of patients and provide constant notification to the caregivers about the condition of patients, for further treatment. Whereas, the systems and software category will exhibit the fastest growth during the forecast period, due to the surging penetration of telemedicine across the world. According to P&S Intelligence, North America held the largest share in the IoT in healthcare market in 2017, due to the implementation of several government and non-government organizations initiatives to augment the adoption of IoT solutions in the healthcare sector, increasing incidence of chronic diseases, and surging research and development (R&D) activities in the health information technology (HIT) sector in the region. Moreover, the presence of a well-developed healthcare infrastructure and constant technological evolution also contributed to the market growth in the region. Read More: https://www.psmarketresearch.com/market-analysis/internet-of-things-in-healthcare-market0 Комментарии 0 Поделились 0 Отзывы -
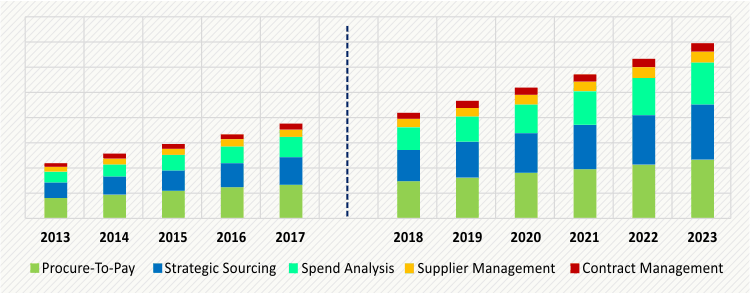
APAC is All Set to Dominate the Retail Sourcing and Procurement Market
The retail sourcing and procurement market is experiencing growth, as per the report by market research company, P&S Intelligence. This growth of the market can be credited to the increasing need for centralized procurement and mounting demand for amplified visibility in the supply chain. Also, the growing concentration on digital transformation would boost the industry's growth in the future.
On the basis of the solution, the retail sourcing and procurement industry is divided into supplier management, strategic sourcing, procure-to-pay, contract management, and spend analysis. Among these, the industry for spending analysis is projected to experience growth with the fastest CAGR, in the coming few years.
Spend analysis solution provides a complete categorizing, grouping, cleansing, and analysis of a company's spending data, which additionally supports them to examine future expenses and support them in planning corporate strategies. Mainly because of such reasons, the industry for spending analysis is expected to escalate across the globe.
On the basis of services, the retail sourcing and procurement market is divided into, consulting, training and support, and implementation, among these the market for implementation held the largest market share, of approximately 49% in the past few years.
Implementing solutions including contract management, strategic sourcing, and others need specialists and trained service providers, who combine several methods to bring together an appropriate operational management system to support an organization. Furthermore, implementation is the most elementary and prior step when the arrangement of a solution is considered and cannot be informally done without appropriate experience.
Fast economic development in emerging countries like China and India will extend plenty of openings for sourcing and procurement solution providers.
Based on organization size, the retail sourcing and procurement industry is segmented into small businesses and large businesses. Between two, in the past few years, large businesses had a larger market share, of above 60%, credited to the fact that the large-sized businesses face more difficult circumstances and complications about the financial and operational activities involved.
Such problems can be shortened by obtaining retail sourcing solutions for contract management, corporate strategy making, risk management, spend analysis, and customer relationship management. Large businesses are projected to continue holding a larger share in the coming few years as well, given their business requirements.
With growing digital transformation, the capability to synchronize information across the business is vital for success. Retailers are concentrating on distributing end-to-end, connected, and cognitive solutions, in order to provide improved value to retailers and help autonomous decision-making. Correspondingly, the strong development of the e-commerce sector is forcing enterprises to be more agile.
Hence, the increasing need for centralized procurement, and mounting demand for amplified visibility in the supply chain. Also, the growing concentration on digital transformation would boost the industry's growth in the future.
Read More: https://www.psmarketresearch.com/market-analysis/retail-sourcing-and-procurement-marketAPAC is All Set to Dominate the Retail Sourcing and Procurement Market The retail sourcing and procurement market is experiencing growth, as per the report by market research company, P&S Intelligence. This growth of the market can be credited to the increasing need for centralized procurement and mounting demand for amplified visibility in the supply chain. Also, the growing concentration on digital transformation would boost the industry's growth in the future. On the basis of the solution, the retail sourcing and procurement industry is divided into supplier management, strategic sourcing, procure-to-pay, contract management, and spend analysis. Among these, the industry for spending analysis is projected to experience growth with the fastest CAGR, in the coming few years. Spend analysis solution provides a complete categorizing, grouping, cleansing, and analysis of a company's spending data, which additionally supports them to examine future expenses and support them in planning corporate strategies. Mainly because of such reasons, the industry for spending analysis is expected to escalate across the globe. On the basis of services, the retail sourcing and procurement market is divided into, consulting, training and support, and implementation, among these the market for implementation held the largest market share, of approximately 49% in the past few years. Implementing solutions including contract management, strategic sourcing, and others need specialists and trained service providers, who combine several methods to bring together an appropriate operational management system to support an organization. Furthermore, implementation is the most elementary and prior step when the arrangement of a solution is considered and cannot be informally done without appropriate experience. Fast economic development in emerging countries like China and India will extend plenty of openings for sourcing and procurement solution providers. Based on organization size, the retail sourcing and procurement industry is segmented into small businesses and large businesses. Between two, in the past few years, large businesses had a larger market share, of above 60%, credited to the fact that the large-sized businesses face more difficult circumstances and complications about the financial and operational activities involved. Such problems can be shortened by obtaining retail sourcing solutions for contract management, corporate strategy making, risk management, spend analysis, and customer relationship management. Large businesses are projected to continue holding a larger share in the coming few years as well, given their business requirements. With growing digital transformation, the capability to synchronize information across the business is vital for success. Retailers are concentrating on distributing end-to-end, connected, and cognitive solutions, in order to provide improved value to retailers and help autonomous decision-making. Correspondingly, the strong development of the e-commerce sector is forcing enterprises to be more agile. Hence, the increasing need for centralized procurement, and mounting demand for amplified visibility in the supply chain. Also, the growing concentration on digital transformation would boost the industry's growth in the future. Read More: https://www.psmarketresearch.com/market-analysis/retail-sourcing-and-procurement-market0 Комментарии 0 Поделились 0 Отзывы

Смотреть ещё