• AI in Cyber Security Market To Reach $101.8 Billion by 2030

    The artificial intelligence (AI) in cyber security market stood at $8.6 billion in 2019, and it is projected to reach $101.8 billion in 2030, advancing at a CAGR of 25.7% during the forecast period (2020–2030). This growth is supported by factors such as the rapid digitization of industries, high penetration of mobile internet, huge investments by governments, information technology (IT) sector, and financial institutions in the AI technology, and shift from conventional banking to digital banking. However, the biggest reason for the market growth remains the alarming cybercrime incidence.

    In August 2019, the Government Accountability Office (GAO) of the U.S. stated that despite combative actions, cybercrimes are growing every year. With the escalating incidence of cyber frauds, such as payment card thefts and identity frauds, organizations are suffering significant financial losses. If these attacks are not countered quickly, they end up having a long-term impact on businesses. AI-driven solutions tackle cyber frauds by identifying threats, refining techniques, reducing the response time, and better distinguishing attacks that need immediate attention.

    Another factor driving the AI in cyber security market growth is the implementation of the bring-your-own-device (BYOD) policy, as it enhances employee satisfaction and increases productivity. However, this policy poses a major risk, as it makes corporate data vulnerable to cyberattacks. The devices of employees have varying hardware and software configurations, and IT departments might not be able to fully qualify, evaluate, and approve every device, which can pose a high security threat to confidential data. AI provides advanced protection through the machine learning (ML) technology and, thus, offers complete endpoint security.

    The categories under the offering segment of the AI in cyber security market include hardware, software, and services. Among these, the hardware category held the largest market share in the historical period (2014–2019). On the other hand, the software category is expected to showcase the fastest growth during the forecast period. AI systems require various kinds of software that include ML algorithms and application program interfaces (API), such as vision, language, speech, and sensor data, to realize the applications for cyber security.

    Geographically, the North American AI in cyber security market generated the highest revenue in 2019 due to the increasing adoption of cyber security solutions in business enterprises to deal with the frequent cyberattacks. The surging incidence of cybercrimes has led to business interruption and huge financial losses. The number of cyberattacks, such as network breaches and phishing emails, has grown at an exorbitant pace in Canada and the U.S. Moreover, the high digitization rate in the region is supporting the market growth in North America.

    Furthermore, the Asia-Pacific (APAC) region is projected to exhibit the fastest growth in the global AI in cyber security market in the forecast period. This would be due to the soaring number of cybercrimes, such as data breaches, financial frauds, and identity thefts, in the region. On account of these factors, organizations have increased their security expenditure to deal with the consequences and costs of more-advanced cyberattacks. Apart from business entities, governments of several countries are also investing huge amounts in cyber security to deal with advanced threats.

    Thus, the rapid digitization and high incidence of cyberattacks will fuel the market growth in the future.

    Read More: https://www.psmarketresearch.com/market-analysis/artificial-intelligence-in-cyber-security-market
    AI in Cyber Security Market To Reach $101.8 Billion by 2030 The artificial intelligence (AI) in cyber security market stood at $8.6 billion in 2019, and it is projected to reach $101.8 billion in 2030, advancing at a CAGR of 25.7% during the forecast period (2020–2030). This growth is supported by factors such as the rapid digitization of industries, high penetration of mobile internet, huge investments by governments, information technology (IT) sector, and financial institutions in the AI technology, and shift from conventional banking to digital banking. However, the biggest reason for the market growth remains the alarming cybercrime incidence. In August 2019, the Government Accountability Office (GAO) of the U.S. stated that despite combative actions, cybercrimes are growing every year. With the escalating incidence of cyber frauds, such as payment card thefts and identity frauds, organizations are suffering significant financial losses. If these attacks are not countered quickly, they end up having a long-term impact on businesses. AI-driven solutions tackle cyber frauds by identifying threats, refining techniques, reducing the response time, and better distinguishing attacks that need immediate attention. Another factor driving the AI in cyber security market growth is the implementation of the bring-your-own-device (BYOD) policy, as it enhances employee satisfaction and increases productivity. However, this policy poses a major risk, as it makes corporate data vulnerable to cyberattacks. The devices of employees have varying hardware and software configurations, and IT departments might not be able to fully qualify, evaluate, and approve every device, which can pose a high security threat to confidential data. AI provides advanced protection through the machine learning (ML) technology and, thus, offers complete endpoint security. The categories under the offering segment of the AI in cyber security market include hardware, software, and services. Among these, the hardware category held the largest market share in the historical period (2014–2019). On the other hand, the software category is expected to showcase the fastest growth during the forecast period. AI systems require various kinds of software that include ML algorithms and application program interfaces (API), such as vision, language, speech, and sensor data, to realize the applications for cyber security. Geographically, the North American AI in cyber security market generated the highest revenue in 2019 due to the increasing adoption of cyber security solutions in business enterprises to deal with the frequent cyberattacks. The surging incidence of cybercrimes has led to business interruption and huge financial losses. The number of cyberattacks, such as network breaches and phishing emails, has grown at an exorbitant pace in Canada and the U.S. Moreover, the high digitization rate in the region is supporting the market growth in North America. Furthermore, the Asia-Pacific (APAC) region is projected to exhibit the fastest growth in the global AI in cyber security market in the forecast period. This would be due to the soaring number of cybercrimes, such as data breaches, financial frauds, and identity thefts, in the region. On account of these factors, organizations have increased their security expenditure to deal with the consequences and costs of more-advanced cyberattacks. Apart from business entities, governments of several countries are also investing huge amounts in cyber security to deal with advanced threats. Thus, the rapid digitization and high incidence of cyberattacks will fuel the market growth in the future. Read More: https://www.psmarketresearch.com/market-analysis/artificial-intelligence-in-cyber-security-market
    WWW.PSMARKETRESEARCH.COM
    AI in Cyber Security Market | Global Revenue Estimation, 2030
    The global artificial intelligence in cyber security market share stood at $8.6 billion in 2019, which is set to progress at a CAGR of 25.7% in between 2020–2030. The implementation of the BYOD policy is driving the AI in cyber security industry.
    0 Комментарии 0 Поделились 0 Отзывы
  • Asia-Pacific LED Lighting Market Set to Exhibit Over 10.0% CAGR

    The Asia-Pacific (APAC) LED lighting market reached a value of $27.5 billion in 2018 and it is predicted to generate a revenue of $58.0 billion by 2024. In addition to this, the market is predicted to progress at a CAGR of 13.0% between 2019 and 2024. The major factors fueling the expansion of the market are the rapid development of smart cities, the rising enactment of favorable government initiatives regarding energy conservation and energy efficiency in this region.

    The governments of many APAC countries are implementing policies for promoting energy efficiency in the region. For instance, many government projects such as the Unnat Jyoti by Affordable LEDs for All (UJALA) enacted by the government in 2015, have already been launched in India for promoting energy efficiency in the country. Furthermore, the government began the Street Light National Programme (SLNP) in 2015 for promoting energy efficiency in the country.

    This program was aimed at replacing 35 million conventional lights in the country with LED lights. Apart from the Indian government, the Chinese and the Australian governments are also implementing policies for promoting the usage of energy-efficient LED street lights in the country. Depending on product type, the market is divided into luminaires and lamps. Between the two, the luminaires category held higher share in the market in the years gone by.

    This was because of the huge requirement for LED lighting fixtures, on account of the construction of commercial buildings and residential houses in the region. Furthermore, the Asia-Pacific LED lighting market is classified into retrofit and new installation, on the basis of installation type. Of these, the new installation category registered higher growth in the market during the past few years, due to the implementation of several government initiatives regarding the usage of LED lights, especially in China and India.

    When indoor LED lighting application is taken into consideration, the APAC LED lighting market is categorized into commercial, industrial, and residential. Out of these, the commercial category held the highest share in the market during the past few years, as per the observations of P&S Intelligence, a market research company based in India. This category includes retail, offices, hospitality and tourism, government, hospitals, banking, financial services, and insurance (BFSI), transportation, and education.

    The growth of this category is caused because of the enactment of favorable government initiatives regarding the usage of LED lights in commercial spaces, especially in India, China, Australia, and Japan. Depending on industrial LED lighting, the market is classified into automotive, chemicals and pharmaceuticals, energy and utilities, food and beverage, oil and gas, telecom, textile, mining, and electronics and semiconductors. Amongst these, the energy and utilities category will demonstrate the fastest growth in the market in the forthcoming years.

    Hence, it can be said with full confidence that the market will register huge growth in the coming years, mainly because of the rising implementation of favorable government policies regarding energy-efficiency and energy conservation and the rapid development of smart cities in various countries of the region.

    Read More: https://www.psmarketresearch.com/market-analysis/apac-led-lighting-market
    Asia-Pacific LED Lighting Market Set to Exhibit Over 10.0% CAGR The Asia-Pacific (APAC) LED lighting market reached a value of $27.5 billion in 2018 and it is predicted to generate a revenue of $58.0 billion by 2024. In addition to this, the market is predicted to progress at a CAGR of 13.0% between 2019 and 2024. The major factors fueling the expansion of the market are the rapid development of smart cities, the rising enactment of favorable government initiatives regarding energy conservation and energy efficiency in this region. The governments of many APAC countries are implementing policies for promoting energy efficiency in the region. For instance, many government projects such as the Unnat Jyoti by Affordable LEDs for All (UJALA) enacted by the government in 2015, have already been launched in India for promoting energy efficiency in the country. Furthermore, the government began the Street Light National Programme (SLNP) in 2015 for promoting energy efficiency in the country. This program was aimed at replacing 35 million conventional lights in the country with LED lights. Apart from the Indian government, the Chinese and the Australian governments are also implementing policies for promoting the usage of energy-efficient LED street lights in the country. Depending on product type, the market is divided into luminaires and lamps. Between the two, the luminaires category held higher share in the market in the years gone by. This was because of the huge requirement for LED lighting fixtures, on account of the construction of commercial buildings and residential houses in the region. Furthermore, the Asia-Pacific LED lighting market is classified into retrofit and new installation, on the basis of installation type. Of these, the new installation category registered higher growth in the market during the past few years, due to the implementation of several government initiatives regarding the usage of LED lights, especially in China and India. When indoor LED lighting application is taken into consideration, the APAC LED lighting market is categorized into commercial, industrial, and residential. Out of these, the commercial category held the highest share in the market during the past few years, as per the observations of P&S Intelligence, a market research company based in India. This category includes retail, offices, hospitality and tourism, government, hospitals, banking, financial services, and insurance (BFSI), transportation, and education. The growth of this category is caused because of the enactment of favorable government initiatives regarding the usage of LED lights in commercial spaces, especially in India, China, Australia, and Japan. Depending on industrial LED lighting, the market is classified into automotive, chemicals and pharmaceuticals, energy and utilities, food and beverage, oil and gas, telecom, textile, mining, and electronics and semiconductors. Amongst these, the energy and utilities category will demonstrate the fastest growth in the market in the forthcoming years. Hence, it can be said with full confidence that the market will register huge growth in the coming years, mainly because of the rising implementation of favorable government policies regarding energy-efficiency and energy conservation and the rapid development of smart cities in various countries of the region. Read More: https://www.psmarketresearch.com/market-analysis/apac-led-lighting-market
    WWW.PSMARKETRESEARCH.COM
    Asia-Pacific LED Lighting Market Size, Share | Industry Analysis Report, 2014–2024
    The Asia-Pacific LED lighting market is estimated to value $27.5 billion in 2018, and is forecasted to grow at a CAGR of 13%, during 2014-2024.
    0 Комментарии 0 Поделились 0 Отзывы
  • Boom Expected in Asia-Pacific Human Enhancement Market in Coming Years

    The global human enhancement market reached a value of $64.8 billion in 2019 and it is predicted to generate a revenue of $271.6 billion by 2030. According to the estimates of the market research firm, P&S Intelligence, the market will progress at a CAGR of 14.7% between 2020 and 2030. The rising incidence of neurological diseases and the growing usage of exoskeletons in rehabilitation centers are the major factors fueling the expansion of the market across the world.

    Robotic exoskeleton systems are extensively used in gait therapy for assisting physically disabled people in walking, sitting, standing, and performing various motor functions. These systems are used for monitoring the movements of patients via sensors and help them regain their physical strength. For example, in the U.S., University Hospitals (UH) use exoskeletons developed by Ekso Bionics Holdings Inc. for helping people suffering from multiple sclerosis (MS), various spine and brain injuries, and Parkinson’s disease.

    Apart from the aforementioned factor, the increasing usage of bionic lenses by the blind and the visually impaired people is also creating lucrative growth opportunities for the players operating in the human enhancement market. These devices have the ability to significantly improve the vision of patients suffering from visual impairment by three times. For instance, Ocumetics Technology Corp., which is a developer of ophthalmic aids based in Canada, produced a bionic lens that can restore vision at all distances.

    Based on technology, the human enhancement market is divided into implants, medical devices, smart devices, and exoskeletons. Out of these, the implants category recorded the highest growth in the market in the past years, on account of the heavy usage of these devices in medical applications, mainly because of the presence of a large geriatric population and the high incidence of neurological and chronic diseases in various countries around the world.

    When application is taken into consideration, the human enhancement market is categorized into defense, industrial, and healthcare. Out of these, the defense category is predicted to demonstrate the fastest growth in the market in the upcoming years. This will be because of the fact that human enhancement systems are widely used in defense applications, on account of their ability to provide mobility, strength, safety, and endurance to soldiers and defense personnel.

    Across the globe, the human enhancement market will exhibit the fastest growth in the Asia-Pacific (APAC) region in the forthcoming years. This will be due to the mushrooming demand for connected wearable devices, on account of the rapid fall in their prices and the surging penetration of the internet, in the regional countries. On the other hand, the highest market advancement will be observed in North America in the upcoming years, as per industry experts.

    Hence, it can be said with full confidence that the market will register substantial growth all over the world in the coming years, primarily because of the rising incidence of neurological diseases, the soaring geriatric population, and the extensive usage of exoskeletons in rehabilitation centers around the world.

    Read More: https://www.psmarketresearch.com/market-analysis/human-enhancement-market
    Boom Expected in Asia-Pacific Human Enhancement Market in Coming Years The global human enhancement market reached a value of $64.8 billion in 2019 and it is predicted to generate a revenue of $271.6 billion by 2030. According to the estimates of the market research firm, P&S Intelligence, the market will progress at a CAGR of 14.7% between 2020 and 2030. The rising incidence of neurological diseases and the growing usage of exoskeletons in rehabilitation centers are the major factors fueling the expansion of the market across the world. Robotic exoskeleton systems are extensively used in gait therapy for assisting physically disabled people in walking, sitting, standing, and performing various motor functions. These systems are used for monitoring the movements of patients via sensors and help them regain their physical strength. For example, in the U.S., University Hospitals (UH) use exoskeletons developed by Ekso Bionics Holdings Inc. for helping people suffering from multiple sclerosis (MS), various spine and brain injuries, and Parkinson’s disease. Apart from the aforementioned factor, the increasing usage of bionic lenses by the blind and the visually impaired people is also creating lucrative growth opportunities for the players operating in the human enhancement market. These devices have the ability to significantly improve the vision of patients suffering from visual impairment by three times. For instance, Ocumetics Technology Corp., which is a developer of ophthalmic aids based in Canada, produced a bionic lens that can restore vision at all distances. Based on technology, the human enhancement market is divided into implants, medical devices, smart devices, and exoskeletons. Out of these, the implants category recorded the highest growth in the market in the past years, on account of the heavy usage of these devices in medical applications, mainly because of the presence of a large geriatric population and the high incidence of neurological and chronic diseases in various countries around the world. When application is taken into consideration, the human enhancement market is categorized into defense, industrial, and healthcare. Out of these, the defense category is predicted to demonstrate the fastest growth in the market in the upcoming years. This will be because of the fact that human enhancement systems are widely used in defense applications, on account of their ability to provide mobility, strength, safety, and endurance to soldiers and defense personnel. Across the globe, the human enhancement market will exhibit the fastest growth in the Asia-Pacific (APAC) region in the forthcoming years. This will be due to the mushrooming demand for connected wearable devices, on account of the rapid fall in their prices and the surging penetration of the internet, in the regional countries. On the other hand, the highest market advancement will be observed in North America in the upcoming years, as per industry experts. Hence, it can be said with full confidence that the market will register substantial growth all over the world in the coming years, primarily because of the rising incidence of neurological diseases, the soaring geriatric population, and the extensive usage of exoskeletons in rehabilitation centers around the world. Read More: https://www.psmarketresearch.com/market-analysis/human-enhancement-market
    WWW.PSMARKETRESEARCH.COM
    Human Enhancement Market | Industry Forecast, 2030
    Human enhancement market is predicted to grow at a CAGR of 14.7% from 2020 to 2030. The growing incidence of neurological diseases and increasing usage of exoskeletons at rehabilitation centers are the major factors driving the expansion of the market
    0 Комментарии 0 Поделились 0 Отзывы
  • Why Does North America Lead OTT Services Market?

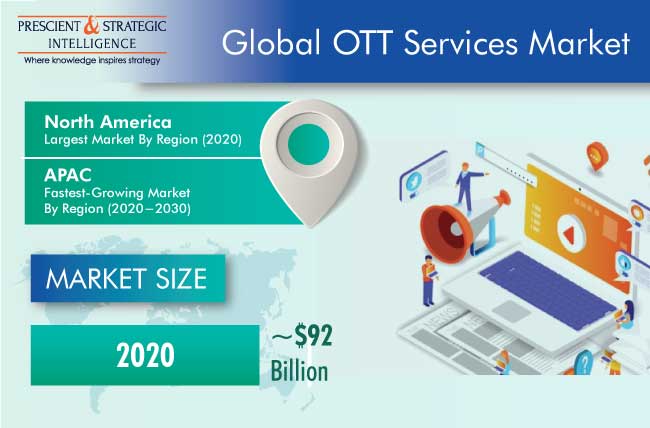
    The over-the-top (OTT) services market will grow at a significant growth during the forecast period (2020–2030), on account of the rising internet speed; the increasing usage of smart devices, such as smartphones, smart TVs, laptops, and internet-connected gaming consoles; and the surging number of internet users. Moreover, the market growth can be credited to the soaring popularity of video-on-demand (VoD) services in developing countries. According to P&S Intelligence, the market was valued at $92 billion revenue in 2020.

    The ballooning demand for OTT services can be majorly ascribed to the surging internet and smart device penetration, as the lowering prices of smart devices and the ability of set-top boxes, smart TVs, laptops, desktops, gaming consoles, and tablets to access high-speed internet has bridged the gap between smart device owners and online content. Moreover, the increasing amount of time being spent by people on their devices, on account of the improving network coverage and expanding 4G/LTE, 5G, and optical fiber networks, will also complement the market growth, worldwide.

    The type segment of the OTT services market is categorized into communication, music streaming, online gaming, VoD, and others, such as eWallet, net banking, and ticket booking. Under this segment, the online gaming category is expected to account for the largest market share throughout the forecast period. This can be primarily ascribed to the rising internet penetration and increasing adoption of smart devices, such as gaming consoles, smartphones, and smart TVs. Presently, internet-connected gaming consoles such as Wii U, Sony Playstation 4, and Xbox One are allowing online gaming.

    In recent years, players of the OTT services market have launched numerous platforms and services and engaged in mergers and acquisitions to stay ahead of their competitors. Some of the major players involved in product launches, and mergers and acquisitions are Kakao Corp., Netflix Inc., Google LLC (YouTube), Apple Inc., Amazon.com Inc., Telstra Corporation Ltd., Facebook Inc., The Walt Disney Company, Roku Inc., and Rakuten Inc. For example, in July 2020, The Walt Disney Company announced the acquisition of Hotstar, an Indian OTT giant, and renamed Hotstar to Disney+ Hotstar to compete against Amazon Prime Video and Netflix.

    Globally, the North American OTT services market generated the highest revenue in 2020, due to the high internet penetration and extensive use of smart devices, such as tablets, laptops, smart TVs, and smartphones, in the region. For instance, the World Bank stated that 89.43% of the U.S. population were internet users in 2019. Additionally, the intense competition among market players, owing to the availability of flexible packages and regional content, is also a key contributor to the market growth in the U.S. and Canada.

    Whereas, the Asia-Pacific (APAC) OTT services market is expected to display the fastest growth during the forecast period. This will be on account of the booming population, surging number of internet users, and expanding smartphone user base in developing countries, such as China and India. According to the United Nations Population Fund (UNFPA), the APAC region is home to nearly 4.3 billion people, accounting for around 60% of the global population. Furthermore, the World Bank estimated that 86.545% of the people in Australia were using the internet in 2017.

    Therefore, the escalating popularity of VoD services and the growing usage of smart devices will catalyze the market growth in the upcoming years.

    Read More: https://www.psmarketresearch.com/market-analysis/ott-services-market
    Why Does North America Lead OTT Services Market? The over-the-top (OTT) services market will grow at a significant growth during the forecast period (2020–2030), on account of the rising internet speed; the increasing usage of smart devices, such as smartphones, smart TVs, laptops, and internet-connected gaming consoles; and the surging number of internet users. Moreover, the market growth can be credited to the soaring popularity of video-on-demand (VoD) services in developing countries. According to P&S Intelligence, the market was valued at $92 billion revenue in 2020. The ballooning demand for OTT services can be majorly ascribed to the surging internet and smart device penetration, as the lowering prices of smart devices and the ability of set-top boxes, smart TVs, laptops, desktops, gaming consoles, and tablets to access high-speed internet has bridged the gap between smart device owners and online content. Moreover, the increasing amount of time being spent by people on their devices, on account of the improving network coverage and expanding 4G/LTE, 5G, and optical fiber networks, will also complement the market growth, worldwide. The type segment of the OTT services market is categorized into communication, music streaming, online gaming, VoD, and others, such as eWallet, net banking, and ticket booking. Under this segment, the online gaming category is expected to account for the largest market share throughout the forecast period. This can be primarily ascribed to the rising internet penetration and increasing adoption of smart devices, such as gaming consoles, smartphones, and smart TVs. Presently, internet-connected gaming consoles such as Wii U, Sony Playstation 4, and Xbox One are allowing online gaming. In recent years, players of the OTT services market have launched numerous platforms and services and engaged in mergers and acquisitions to stay ahead of their competitors. Some of the major players involved in product launches, and mergers and acquisitions are Kakao Corp., Netflix Inc., Google LLC (YouTube), Apple Inc., Amazon.com Inc., Telstra Corporation Ltd., Facebook Inc., The Walt Disney Company, Roku Inc., and Rakuten Inc. For example, in July 2020, The Walt Disney Company announced the acquisition of Hotstar, an Indian OTT giant, and renamed Hotstar to Disney+ Hotstar to compete against Amazon Prime Video and Netflix. Globally, the North American OTT services market generated the highest revenue in 2020, due to the high internet penetration and extensive use of smart devices, such as tablets, laptops, smart TVs, and smartphones, in the region. For instance, the World Bank stated that 89.43% of the U.S. population were internet users in 2019. Additionally, the intense competition among market players, owing to the availability of flexible packages and regional content, is also a key contributor to the market growth in the U.S. and Canada. Whereas, the Asia-Pacific (APAC) OTT services market is expected to display the fastest growth during the forecast period. This will be on account of the booming population, surging number of internet users, and expanding smartphone user base in developing countries, such as China and India. According to the United Nations Population Fund (UNFPA), the APAC region is home to nearly 4.3 billion people, accounting for around 60% of the global population. Furthermore, the World Bank estimated that 86.545% of the people in Australia were using the internet in 2017. Therefore, the escalating popularity of VoD services and the growing usage of smart devices will catalyze the market growth in the upcoming years. Read More: https://www.psmarketresearch.com/market-analysis/ott-services-market
    WWW.PSMARKETRESEARCH.COM
    OTT Services Market | Trends And Growth Forecast Report, 2030
    The global OTT services market generated ~$92 billion revenue in 2020 and it is expected to demonstrate robust growth in between 2021-2030. Increasing internet and smart device penetration are propelling the growth of OTT market.
    0 Комментарии 0 Поделились 0 Отзывы
  • Growing Internet Penetration Supporting Structured Cabling Market Surge in Asia-Pacific

    The global structured cabling market revenue stood at $6,912.1 million in 2021, and it is predicted to rise to $12,916.5 million by 2030. According to the estimates of the market research organization, P&S Intelligence, the market will exhibit a CAGR of 7.2% from 2021 to 2030 (forecast period). The major factors fueling the expansion of the market are the growing requirement for high bandwidths and demand for effective cabling management. Additionally, the advent of the internet of things (IoT) is also supporting the growth of the market across the globe.

    The surging penetration of the internet has caused a sharp rise in the need for high bandwidths, as high bandwidths enable the smooth operation of various business processes. Since cabling can provide high bandwidths, the growing demand for improved bandwidths is driving the expansion of the structured cabling market. Enterprises are rapidly modifying their information technology (IT) infrastructure, on account of the mushrooming use of bandwidth-intensive applications, such as IP-based videoconferencing, digital audio and video, and voice over IP (VoIP).

    Cabling is being increasingly used by companies operating in the government, commercial, industrial, and telecommunication sectors for improving their IT infrastructure. Structured cabling assists in making cabling management simple, as it can be easily managed and laid down without requiring a large number of skilled staff members. Thus, the soaring requirement for hassle-free IT infrastructure is propelling the progress of the market, as it reduces the time and costs for government agencies, industries, and data centers.

    It provides a more standardized and organized approach in comparison to patch cords. Depending on product, the structured cabling market is divided into fiber cables, copper cables, fiber components, and copper components. Out of these, the fiber cables category is predicted to demonstrate the highest growth rate in the market in the forthcoming years. This is credited to the growing requirement for high bandwidths, high network security, reliable networking, and low signal attenuation.

    The market is also categorized into commercial, telecommunication, industrial, and government, on the basis of end use. Amongst these, the telecommunication category is predicted to contribute the highest revenue to the market in the coming years. This is credited to the growing penetration of the internet and mushrooming requirement for high-speed internet connectivity, especially in emerging economies across the world. Geographically, Asia-Pacific (APAC) will hold the largest share in the structured cabling market in the forthcoming years.

    This is ascribed to the growing need for cloud computing, which is subsequently pushing up the demand for structured cabling at data centers. Additionally, the progress of the Indian structured cabling industry is also supporting the growth of the regional market. This is attributed to the ballooning requirement for copper structured cabling, owing to the rising demand for high data transmission rates and improved bandwidth in the country. Additionally, the rapid digitization of business operations in various regional countries is also supporting the expansion of the market in the region.

    Hence, it can be safely said that the demand for structured cabling will surge sharply in the coming years, primarily because of the increasing internet penetration and growing need for high bandwidths.

    Read More: https://www.psmarketresearch.com/market-analysis/structured-cabling-market
    Growing Internet Penetration Supporting Structured Cabling Market Surge in Asia-Pacific The global structured cabling market revenue stood at $6,912.1 million in 2021, and it is predicted to rise to $12,916.5 million by 2030. According to the estimates of the market research organization, P&S Intelligence, the market will exhibit a CAGR of 7.2% from 2021 to 2030 (forecast period). The major factors fueling the expansion of the market are the growing requirement for high bandwidths and demand for effective cabling management. Additionally, the advent of the internet of things (IoT) is also supporting the growth of the market across the globe. The surging penetration of the internet has caused a sharp rise in the need for high bandwidths, as high bandwidths enable the smooth operation of various business processes. Since cabling can provide high bandwidths, the growing demand for improved bandwidths is driving the expansion of the structured cabling market. Enterprises are rapidly modifying their information technology (IT) infrastructure, on account of the mushrooming use of bandwidth-intensive applications, such as IP-based videoconferencing, digital audio and video, and voice over IP (VoIP). Cabling is being increasingly used by companies operating in the government, commercial, industrial, and telecommunication sectors for improving their IT infrastructure. Structured cabling assists in making cabling management simple, as it can be easily managed and laid down without requiring a large number of skilled staff members. Thus, the soaring requirement for hassle-free IT infrastructure is propelling the progress of the market, as it reduces the time and costs for government agencies, industries, and data centers. It provides a more standardized and organized approach in comparison to patch cords. Depending on product, the structured cabling market is divided into fiber cables, copper cables, fiber components, and copper components. Out of these, the fiber cables category is predicted to demonstrate the highest growth rate in the market in the forthcoming years. This is credited to the growing requirement for high bandwidths, high network security, reliable networking, and low signal attenuation. The market is also categorized into commercial, telecommunication, industrial, and government, on the basis of end use. Amongst these, the telecommunication category is predicted to contribute the highest revenue to the market in the coming years. This is credited to the growing penetration of the internet and mushrooming requirement for high-speed internet connectivity, especially in emerging economies across the world. Geographically, Asia-Pacific (APAC) will hold the largest share in the structured cabling market in the forthcoming years. This is ascribed to the growing need for cloud computing, which is subsequently pushing up the demand for structured cabling at data centers. Additionally, the progress of the Indian structured cabling industry is also supporting the growth of the regional market. This is attributed to the ballooning requirement for copper structured cabling, owing to the rising demand for high data transmission rates and improved bandwidth in the country. Additionally, the rapid digitization of business operations in various regional countries is also supporting the expansion of the market in the region. Hence, it can be safely said that the demand for structured cabling will surge sharply in the coming years, primarily because of the increasing internet penetration and growing need for high bandwidths. Read More: https://www.psmarketresearch.com/market-analysis/structured-cabling-market
    WWW.PSMARKETRESEARCH.COM
    Structured Cabling Market Insight and Forecast By 2030
    The global structured cabling market will generate an estimated $6,912.1 million revenue in 2021, and it is expected to grow at a CAGR of 7.2% during 2021–2030.
    0 Комментарии 0 Поделились 0 Отзывы
  • How Are Government Efforts Driving GIS in Disaster Management Market?

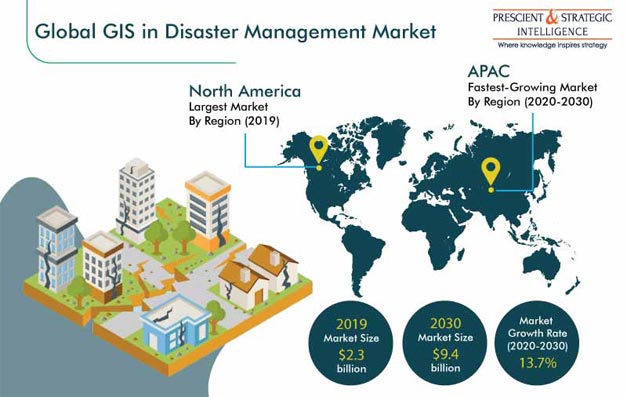
    The geographic information system (GIS) in disaster management market is expected to be driven by the rising incidence of natural disasters and increasing utilization of advanced technologies in the government sector. As a result, the licensing and subscription of these solutions will fetch software vendors $9.4 billion by 2030. From $2.3 billion in 2019, the sales revenue will increase at a 13.7% CAGR during 2020–2030 (forecast period). By using geographic information systems to capture geographical and spatial data, the likeliness and impact of a disaster can be determined.

    Based on solution, the GIS in disaster management market is classified into preparedness, mitigation, recovery, and response, among which the mitigation classification held the dominating share during 2014–2019 (historical period). This was because government bodies around the world are strongly focusing on reducing the impact of disasters on property and life. Geographic information system solutions designed for disaster mitigation help identify natural hazards and assess risk, providing precise data for the same, which allows emergency response departments to plan their containment and redevelopment efforts.

    Similarly, under segmentation by technology, the categories in the industry are satellite imaging, light detection and ranging (LiDAR), remote sensing, and others. In 2019, remote sensing was the largest category in the GIS in disaster management market, as this technology is widely used for inspecting disaster-struck areas and assessing the impact. Compared to imaging by helicopters, remote sensing is cost-effective, and it also offers detailed spatial classification and coverage. During the forecast period, the LiDAR category will advance the fastest, as LiDAR helps identify the worst-affected areas and prepare detailed maps.

    The increasing number of natural calamities is one of the key factors driving the requirement for geographic information systems for disaster management. The software is being utilized for assessing safe shelter areas, providing early warnings after real-time tracking, identifying the potential impact on bridges, roads, and buildings, and evaluating emergency supply distribution. The Weather, Climate, and Catastrophe Insight: 2019 Annual Report says that 409 natural disasters resulted in losses of $232 billion in 2019, with floods proving the most severe, leading to an $82 billion financial loss.

    Another significant propellor of the GIS in disaster management market is the increasing adoption of advanced technology by government departments. Geographic information systems are being used to help people prepare for disasters, effectively manage disaster situations, predict emergencies, carry out search and rescue operations, and estimate the overall damage. For instance, after over 30 tornadoes hit Alabama, Florida, and Georgia in March 2019, the National Weather Service (NWS), National Oceanic and Atmospheric Administration (NOAA), and Alabama Emergency Management Agency deployed geographic information system to map their route and strength.

    During the historical period, North America was the largest contributor to the GIS in disaster management market, and it will continue being so till 2030. Here, investments in geographic-information-system-equipped emergency management approaches are increasing, the government is offering strong support, and the public is becoming rapidly aware of disasters and mitigation strategies. The highest CAGR during the forecast period will be seen by the Asia-Pacific (APAC) region, as a result of the rising incidence of natural disasters in India, China, the Philippines, Japan, and South Korea and increasing containment efforts by governments.

    Therefore, as the number and severity of natural and human-made disasters increases, the demand for advanced solutions that can help governments in limiting the impact will keep rising.

    Read More: https://www.psmarketresearch.com/market-analysis/gis-in-disaster-management-market-analysis
    How Are Government Efforts Driving GIS in Disaster Management Market? The geographic information system (GIS) in disaster management market is expected to be driven by the rising incidence of natural disasters and increasing utilization of advanced technologies in the government sector. As a result, the licensing and subscription of these solutions will fetch software vendors $9.4 billion by 2030. From $2.3 billion in 2019, the sales revenue will increase at a 13.7% CAGR during 2020–2030 (forecast period). By using geographic information systems to capture geographical and spatial data, the likeliness and impact of a disaster can be determined. Based on solution, the GIS in disaster management market is classified into preparedness, mitigation, recovery, and response, among which the mitigation classification held the dominating share during 2014–2019 (historical period). This was because government bodies around the world are strongly focusing on reducing the impact of disasters on property and life. Geographic information system solutions designed for disaster mitigation help identify natural hazards and assess risk, providing precise data for the same, which allows emergency response departments to plan their containment and redevelopment efforts. Similarly, under segmentation by technology, the categories in the industry are satellite imaging, light detection and ranging (LiDAR), remote sensing, and others. In 2019, remote sensing was the largest category in the GIS in disaster management market, as this technology is widely used for inspecting disaster-struck areas and assessing the impact. Compared to imaging by helicopters, remote sensing is cost-effective, and it also offers detailed spatial classification and coverage. During the forecast period, the LiDAR category will advance the fastest, as LiDAR helps identify the worst-affected areas and prepare detailed maps. The increasing number of natural calamities is one of the key factors driving the requirement for geographic information systems for disaster management. The software is being utilized for assessing safe shelter areas, providing early warnings after real-time tracking, identifying the potential impact on bridges, roads, and buildings, and evaluating emergency supply distribution. The Weather, Climate, and Catastrophe Insight: 2019 Annual Report says that 409 natural disasters resulted in losses of $232 billion in 2019, with floods proving the most severe, leading to an $82 billion financial loss. Another significant propellor of the GIS in disaster management market is the increasing adoption of advanced technology by government departments. Geographic information systems are being used to help people prepare for disasters, effectively manage disaster situations, predict emergencies, carry out search and rescue operations, and estimate the overall damage. For instance, after over 30 tornadoes hit Alabama, Florida, and Georgia in March 2019, the National Weather Service (NWS), National Oceanic and Atmospheric Administration (NOAA), and Alabama Emergency Management Agency deployed geographic information system to map their route and strength. During the historical period, North America was the largest contributor to the GIS in disaster management market, and it will continue being so till 2030. Here, investments in geographic-information-system-equipped emergency management approaches are increasing, the government is offering strong support, and the public is becoming rapidly aware of disasters and mitigation strategies. The highest CAGR during the forecast period will be seen by the Asia-Pacific (APAC) region, as a result of the rising incidence of natural disasters in India, China, the Philippines, Japan, and South Korea and increasing containment efforts by governments. Therefore, as the number and severity of natural and human-made disasters increases, the demand for advanced solutions that can help governments in limiting the impact will keep rising. Read More: https://www.psmarketresearch.com/market-analysis/gis-in-disaster-management-market-analysis
    WWW.PSMARKETRESEARCH.COM
    GIS in Disaster Management Market | Growth Statistics By 2030
    The global GIS in disaster management market size was $2.3 billion in 2019, and it is projected to witness a CAGR of 13.7% during the forecast period (2020–2030). The rising preference for GIS in disaster management support applications is the key trend being observed in the GIS in disaster management industry.
    0 Комментарии 0 Поделились 0 Отзывы
  • Control Valves Market Analysis by Trends, Size, Share, Growth Opportunities, and Emerging Technologies

    Due to the booming population in several countries, the demand for energy is soaring. This is, in turn, pushing up the requirement for consistent power production and transportation. Moreover, the rising energy requirements are causing rapid advancements and innovations in the systems used for producing, processing, and transporting energy. As control valves are heavily used in power plants for managing the flow of steam and water, the growing energy demand is positively impacting the sales of control valves.

    Control valves are also used for keeping the energy demand-supply gap very narrow in order to prevent frequent power outages and load shedding. Furthermore, the discovery of several fossil fuel reserves in various Asia-Pacific (APAC) countries such as Thailand and China, on account of advancements in exploration and production (E&P) methods and technologies, is predicted to create lucrative growth opportunities for the companies producing control valves in the future years.

    Browse detailed report - https://www.psmarketresearch.com/market-analysis/control-valves-market

    Globally, the control valves market is presently the most lucrative in Asia-Pacific (APAC) and North America. This is because of the widespread usage of these valves in various industries for maintaining the flow rates of fluids and production. In addition to this, the discovery of oil and gas fields and the huge investments made in the oil and gas industry are fueling the demand for control valves in these regions.

    Hence, it can be said without any hesitation that the sales of control valves would shoot-up around the world in the forthcoming years, primarily because of their growing requirement in the power sector and oil and gas industry and their rising usage in the pharmaceuticals industry.

    Control Valves Market Analysis by Trends, Size, Share, Growth Opportunities, and Emerging Technologies Due to the booming population in several countries, the demand for energy is soaring. This is, in turn, pushing up the requirement for consistent power production and transportation. Moreover, the rising energy requirements are causing rapid advancements and innovations in the systems used for producing, processing, and transporting energy. As control valves are heavily used in power plants for managing the flow of steam and water, the growing energy demand is positively impacting the sales of control valves. Control valves are also used for keeping the energy demand-supply gap very narrow in order to prevent frequent power outages and load shedding. Furthermore, the discovery of several fossil fuel reserves in various Asia-Pacific (APAC) countries such as Thailand and China, on account of advancements in exploration and production (E&P) methods and technologies, is predicted to create lucrative growth opportunities for the companies producing control valves in the future years. Browse detailed report - https://www.psmarketresearch.com/market-analysis/control-valves-market Globally, the control valves market is presently the most lucrative in Asia-Pacific (APAC) and North America. This is because of the widespread usage of these valves in various industries for maintaining the flow rates of fluids and production. In addition to this, the discovery of oil and gas fields and the huge investments made in the oil and gas industry are fueling the demand for control valves in these regions. Hence, it can be said without any hesitation that the sales of control valves would shoot-up around the world in the forthcoming years, primarily because of their growing requirement in the power sector and oil and gas industry and their rising usage in the pharmaceuticals industry.
    WWW.PSMARKETRESEARCH.COM
    Control Valves Market Size, Share | Industry Growth & Forecast to 2023
    The Global Control Valves Market is expected to surpass $16,057.5 million by 2023, witnessing a CAGR of 6.3% during forecast period (2018–2023).
    0 Комментарии 0 Поделились 0 Отзывы
Реклама